
Introduction
When I published my new work OverFlow to arXiv and added the model to the Coqui-TTS framework. Someone on the discord channel asked me that our system OverFlow had a parameter called sampling temperature what is that temperature? And recalled that OpenAI’s whisper and GPT-3 also have a sampling temperature. So I explained to him in the discord chat. So, I thought I might as well write a post about it and put it in a more accessible place.
What is the need for sampling temperature?
The first thing we will talk about is why we need the temperature parameter.
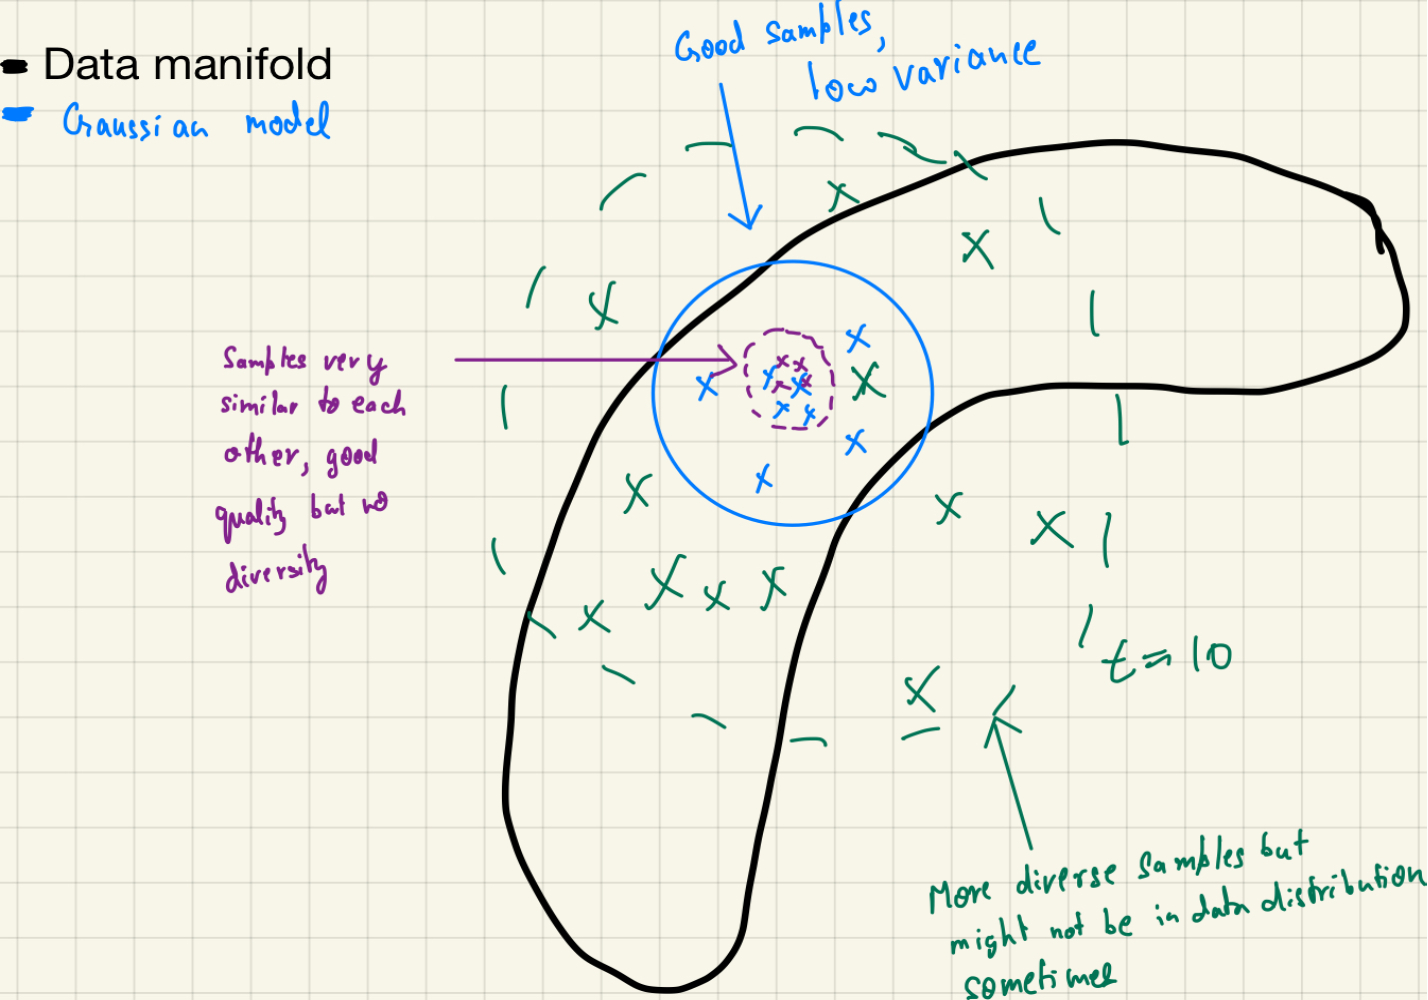
- Let’s assume our two-dimensional “ground truth” data has a banana-shaped distribution in the data manifold! (i.e the actual data in a 2-D space sits on a banana-looking distribution)
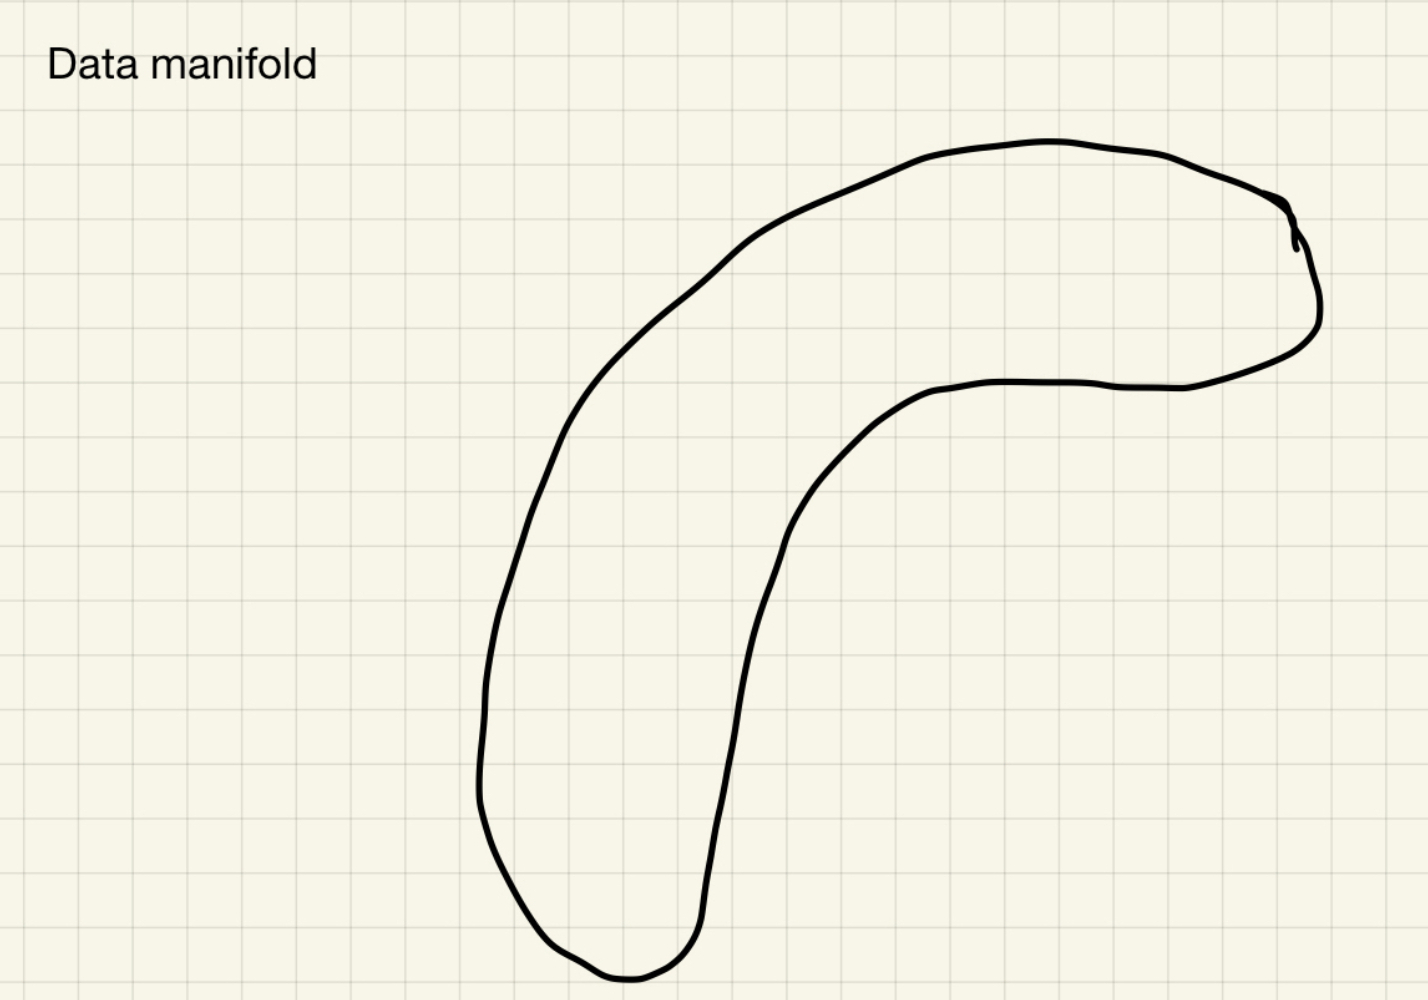 The data manifold
- And we have trained a 2-D isotropic gaussian distribution to fit the data manifold. (i.e the gaussian distribution is a 2-D isotropic gaussian distribution)
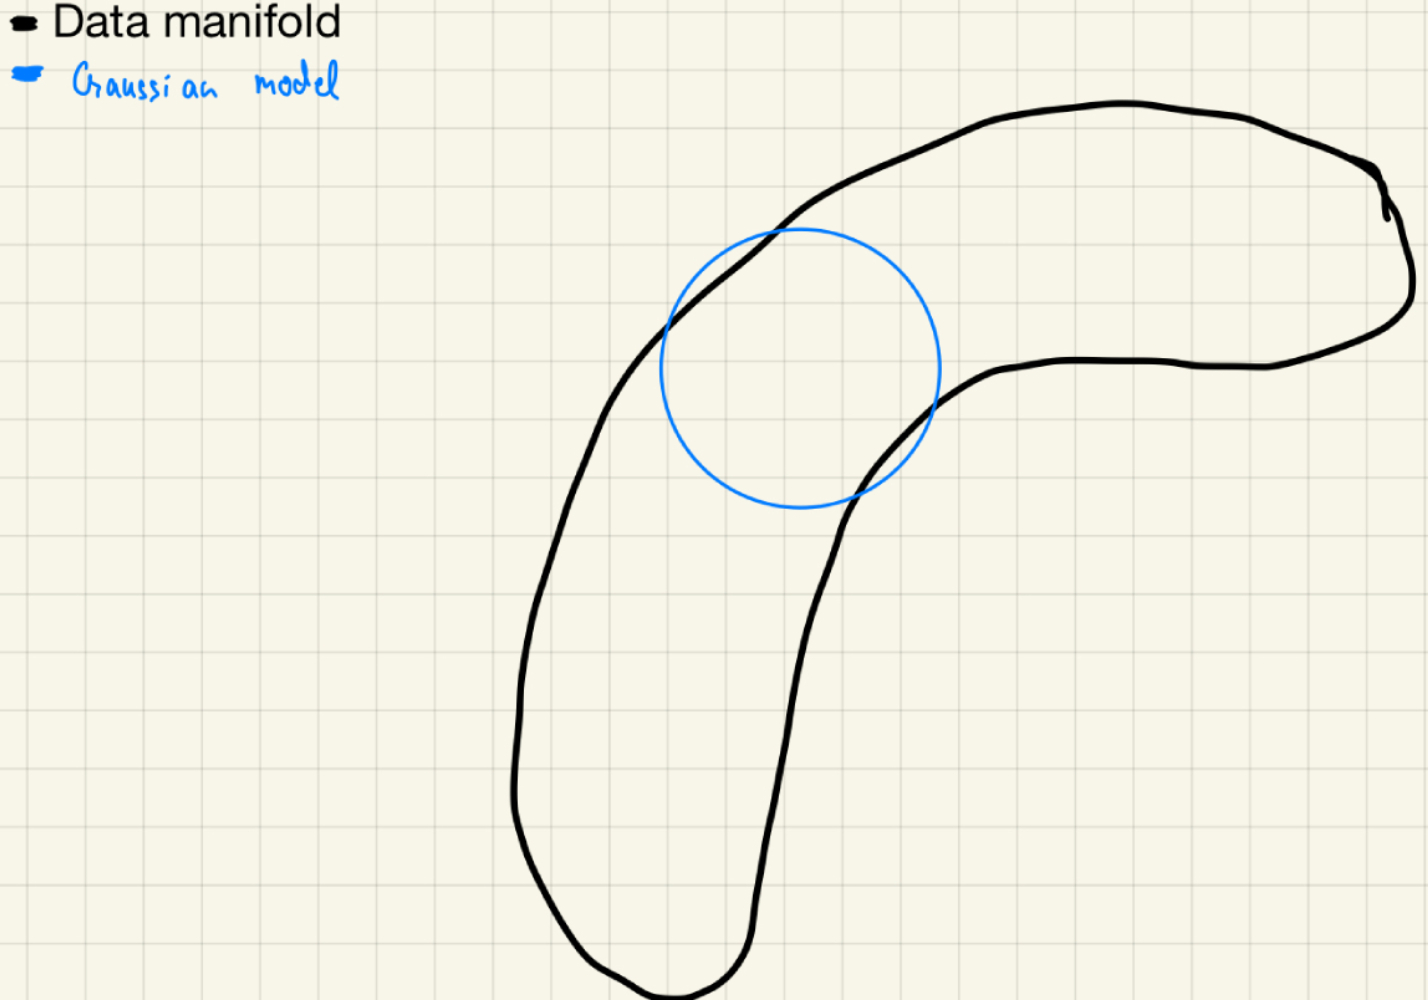 Fitting an isotropic gaussian to the data
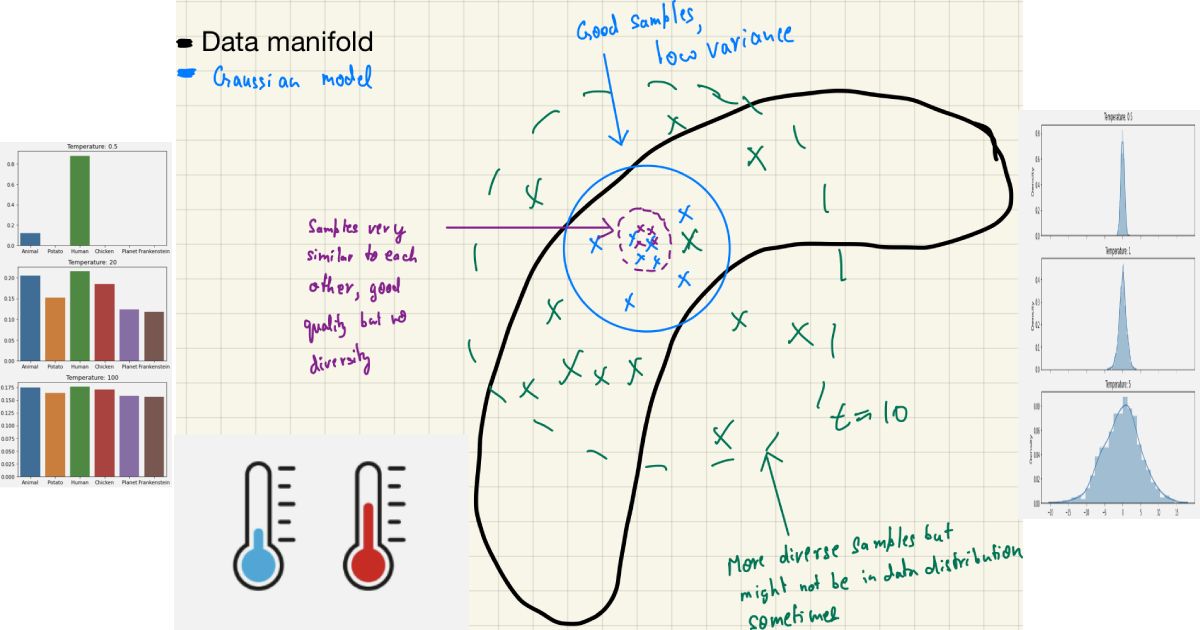
- Now, we can sample from the gaussian distribution to generate new samples but the problem is that the samples are very similar to each other and they are not very diverse.
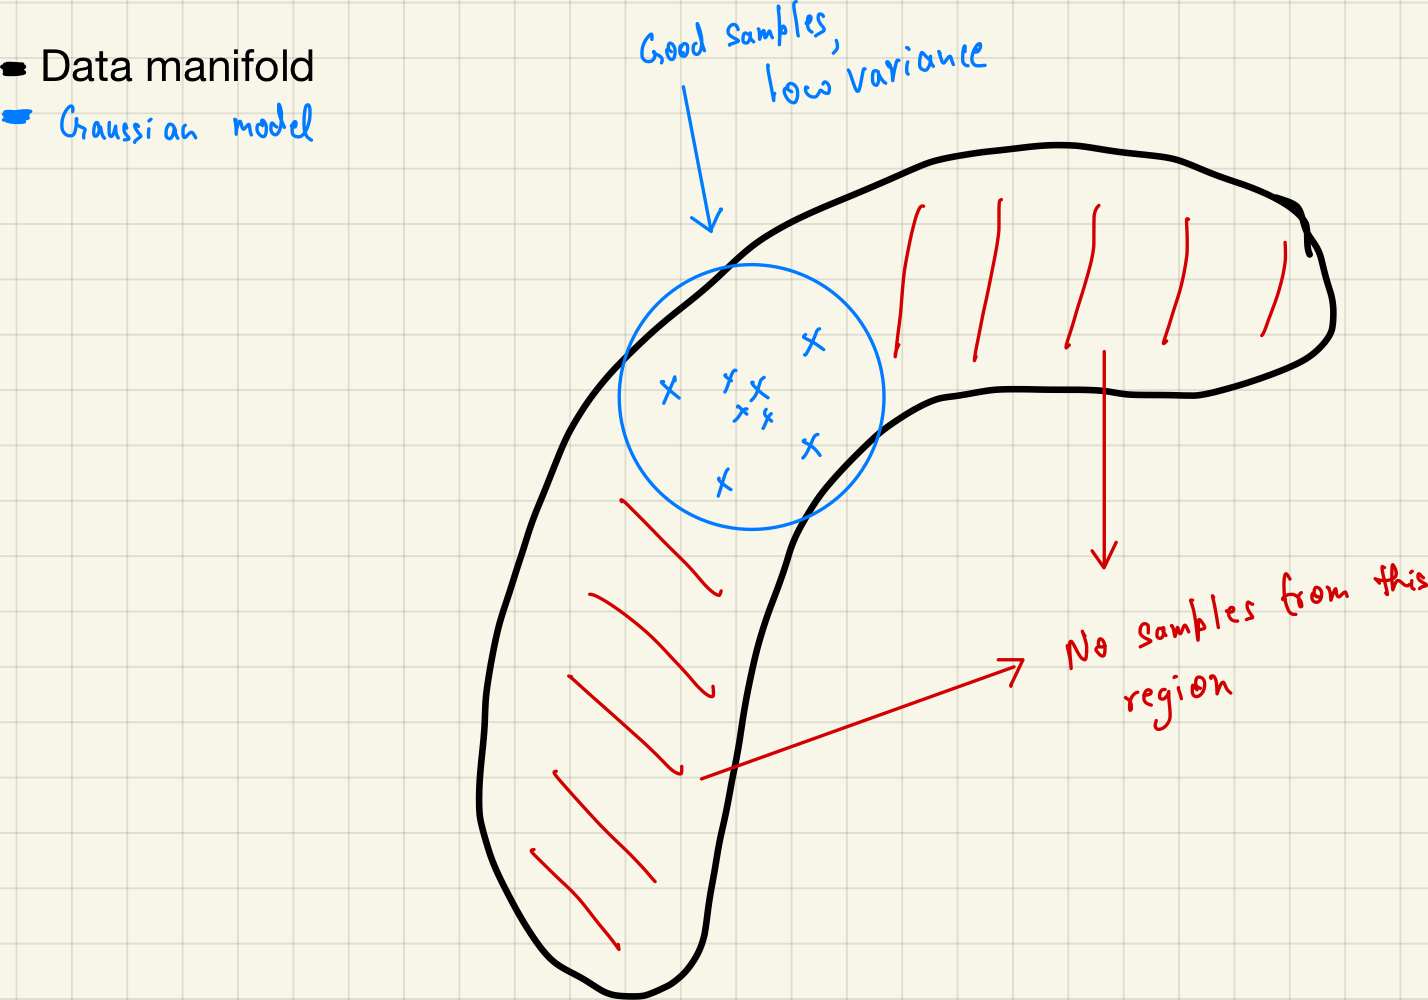 Sampling from the fitted gaussian distribution
- So we change the temperature and for different temperatures, we get different sample quality.
 Sampling with different temperature
So, when the temperature is low, in purple $\tau=0.2$ we get very similar samples and when the temperature is high, in green $\tau=10$ we get very diverse samples. So, we can say that the sampling temperature is a hyperparameter that controls the randomness of the sampling process. The higher the sampling temperature, the more random the sampling process is. The lower the sampling temperature, the less randomness we put in the sampling process.
Further, we can reason about the sampling temperature in two ways for different types of data distributions ( i.e discrete and continuous):
- The sampling temperature over a discrete set of tokens like in OpenAI’s whisper and GPT-3 models.
- The sampling temperature over a continuous random variable like in flow-based models or other probabilistic machine learning models. (This is the case in OverFlow)
Sampling temperature over a discrete set of tokens
These models are trained to predict the next token in a sequence. So, the output of the model before the final sigmoid layer is a vector of weights for each token in the vocabulary, which we convert into a probability distribution using the softmax function. The softmax function is a function that takes a vector of real numbers and converts it into a vector of probabilities that sum to 1 and each value is greater than or equal to zero (theoretically softmax can never generate zeros) which is the definition of softmax. The softmax function is defined as:
\[\begin{align} \text{softmax}(x_i) = \frac{e^{x_i}}{\sum_{j=1}^{n} e^{x_j}} \end{align}\]where $x_i$ is the input vector and $n$ is the number of tokens in the vocabulary. What if we add a temperature parameter to the softmax function? This can be done by simply multiplying and dividing the input vector by $e^{1/\tau}$ temperature parameter. The new softmax function is defined as:
\[\begin{align} \text{softmax}(x_i) = \frac{e^{x_i / \tau}}{\sum_{j=1}^{n} e^{x_j / \tau}} \end{align}\]The sampling temperature is a hyperparameter that controls the randomness of the sampling process. The higher the sampling temperature, the more random the sampling process is. The lower the sampling temperature, the more deterministic the sampling process is. How can we visualize it? Suppose we have the probability distribution over the output of the model after the previous tokens as I am a and it looks like this:
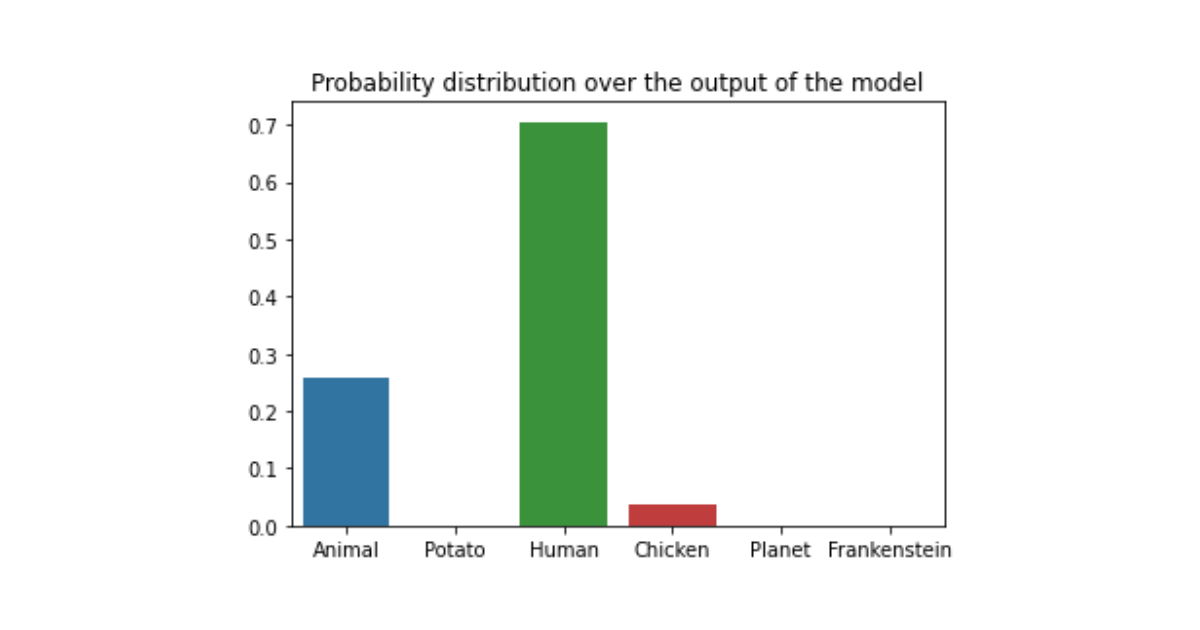 Softmax output of the model
The model is very certain which token to sample next (in a greedy decoding manner). As we can see that probability of the token
humanis very high compared to the other tokens.
Now let’s change the temperature of the softmax function and see what happens. Let’s look at the probability distribution.
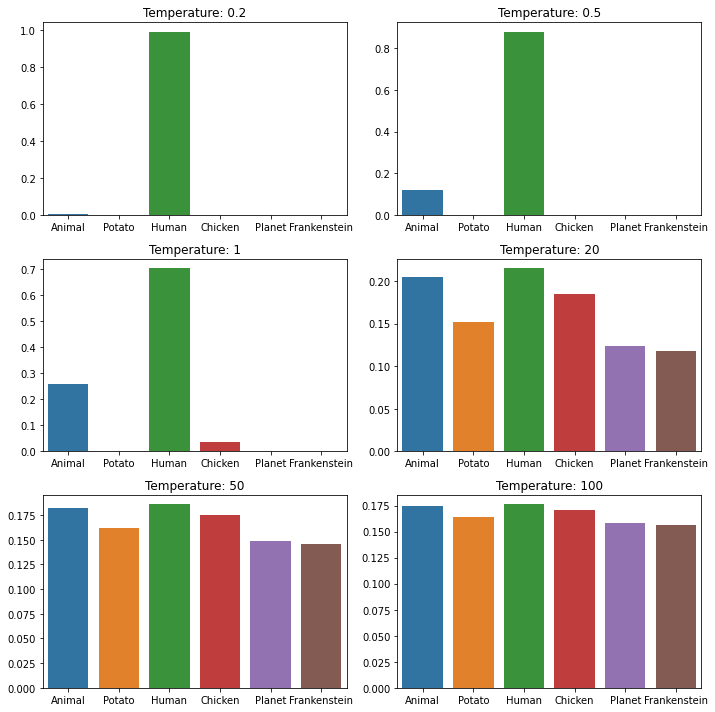 Probability distribution with different temperatures
We see that by increasing the temperature, we can turn a very skewed distribution into a more uniform distribution (thus increasing the entropy and adding more randomness) so the model can sample some other tokens as well. This is the reason why we can get some weird outputs from the model when we increase the temperature too much as we force the model to sample randomness. The model is not very certain about the next token to sample and it samples some other tokens as well. We can also say that increasing the sampling temperature increases the uncertainty of the model.
Sampling temperature over a continuous random variable
In probability density-based models, we sample from a continuous random variable. The sampling temperature is a hyperparameter that controls the randomness of the sampling process. The higher the sampling temperature, the more random the sampling process is. The lower the sampling temperature, the less randomness we put in the sampling process. We can re-parameterize the sampling from a gaussian distribution with mean $\mu$ and standard deviation $\sigma$ as:
\[\mathcal{N}\left( \mu, \sigma \right) = \mu + \sigma * \epsilon\]where $\epsilon$ is a random variable sampled from a standard normal distribution $\mathcal{N}\left( 0, 1 \right)$.
We can add a temperature parameter to the standard deviation $\sigma$ and re-parameterize the sampling as:
\[\mathcal{N}\left( \mu, \sigma \right) = \mu + \sigma * \tau * \epsilon\]where $\tau$ is the sampling temperature.
We can visualize the effect of the sampling temperature on the sampling process by plotting the probability density function of the gaussian distribution with different sampling temperatures.
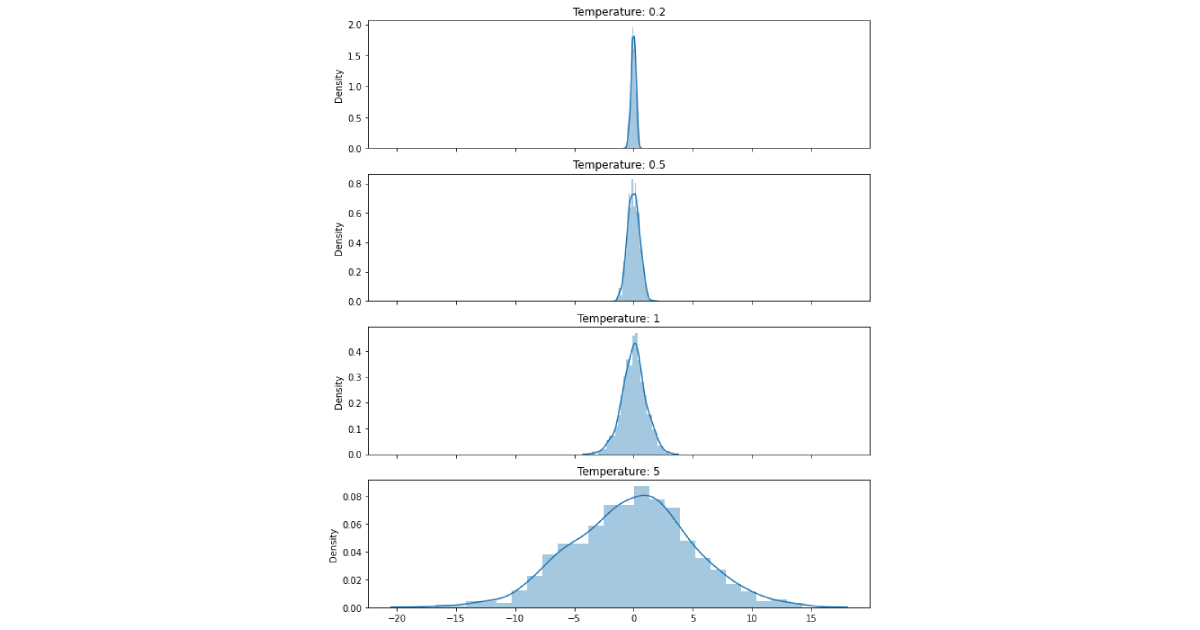 The probability density function of the gaussian distribution with different sampling temperatures
Notice how the gaussian flattens as we increase the sampling temperature. This can be useful to sample from a gaussian distribution with a higher variance. We can also say that increasing the sampling temperature increases the uncertainty of the model, which can be useful to sample varied samples from the same distribution.
This is very useful in areas like speech synthesis where there is no one way of speaking a sentence or in areas like image generation where there is no one way of generating an image of lets say a dog or a cat. We can sample from the same distribution with different sampling temperatures to get varied samples.